Chapter 2 · Foundations
Sound Theory
“The sensation of a musical tone is due to a rapid periodic motion of the sonorous body; the sensation of a noise to non-periodic motions.”
—Hermann von Helmholtz, On the Sensations of Tone
By the end of this chapter, you will be able to:
- Describe sound as acoustic energy by explaining compression and rarefaction, the role of the medium, the speed of sound in air, and the mathematical relationships among frequency, wavelength, and amplitude
- Identify the five practical frequency bands of the audible spectrum—bass, low mids, mid-mids, high mids/presence, and treble—and apply the standard studio vocabulary for each band to describe tonal problems and targets
- Distinguish among the three principal decibel scales used in audio: dB SPL for acoustic sound-pressure level, dBFS for digital headroom, and LUFS/RMS for perceived loudness and streaming normalization targets
- Explain how the harmonic series and the ADSR volume envelope combine to produce timbre, using the contrast between a piano and a guitar playing the same pitch as a concrete example
- Apply the inverse square law to predict how microphone distance affects captured level, and explain how the Fletcher-Munson equal-loudness curves justify using a calibrated monitoring reference level as an engineering practice
- Identify phase relationships—constructive interference, destructive interference, and comb filtering—and describe how each manifests in multi-microphone setups, room acoustics, and monitor calibration
- Explain three core psychoacoustic phenomena—frequency masking, the precedence/Haas effect, and binaural localization—and describe how each one informs EQ, delay, and panning decisions in a mix
- Select appropriate hearing-conservation practices by citing OSHA and NIOSH noise-exposure limits and identifying the daily studio habits that prevent cumulative hearing damage
This is the chapter that separates engineers who push buttons from engineers who understand what the buttons do. Sound theory can feel academic at first—wavelengths, decibels, phase relationships—but every concept here has a direct, practical application in the studio. When you boost 3 kHz on a vocal, you are making a decision about frequency. When two microphones on the same snare make it sound thin and hollow until you flip the phase on one, you are hearing interference. When you notice that your mix sounds different at low volume than at high volume, you are hearing the Fletcher–Munson curves in action. The physics is not separate from the music. It is the music.
What Is Sound?
suggest a correctionClap your hands. What just happened? Your palms collided, the impact pushed the surrounding air molecules together, and that disturbance rippled outward in every direction until it reached your eardrums. That is sound: a form of energy called acoustic energy—pressure variations traveling through a medium over time. It is not a thing you can hold. It is an event—a disturbance rippling outward from a source, carrying energy from one place to another. If those pressure variations repeat fast enough and strong enough to fall within the range of human hearing, your brain interprets them as sound. Acoustic energy is the raw material of everything we do in the studio.
Energy is the ability to do work or exert force—the power to change. It cannot be created or destroyed, only converted from one form to another. That single law of physics governs every step of the recording process. Think about what happens when a vocalist records a take: breath and muscle become vibration in the vocal cords (mechanical energy), which becomes pressure waves in the air (acoustic energy), which a microphone converts into voltage traveling down a cable (electrical energy), which a converter encodes as ones and zeros on a hard drive (digital data). When you play it back, the process reverses: digital to electrical to acoustic—and the listener hears the voice. Every link in the signal chain is an energy conversion, and understanding that chain is what this chapter is about.
The material that carries the sound is called the medium—usually air, but sound can travel through virtually anything: water, wood, steel, concrete. It cannot travel through a vacuum, because there are no molecules to carry the vibration. The speed at which sound moves through a medium is called its velocity. In dry air at 20°C (68°F), the velocity of sound is approximately 1,125 feet per second (343 m/s), or about 768 mph—fast, but hundreds of thousands of times slower than the electrical signals traveling through your studio cables. Sound travels about 4.3 times faster in water (1,484 m/s) and even faster through solids, which is why you can hear a train coming by pressing your ear to the rail long before you hear it through the air.
Sound does not always travel in straight lines. When a wave encounters an obstacle or an opening, it bends around edges—a behavior called diffraction. Whether it bends significantly depends on how the obstacle's size compares to the wavelength: when the wavelength is large relative to the object, the wave wraps around it with ease; when the wavelength is small relative to the object, the wave is blocked or reflected. A kick drum at 60 Hz has a wavelength of nearly 19 feet—it diffracts around a typical gobo as if the panel were not there. A cymbal's high-frequency splash at 10 kHz has a wavelength under two inches and is stopped cold by the same panel. This is why a well-placed gobo eliminates cymbal bleed from an adjacent mic but does almost nothing to control the low end of the kit. Related to diffraction but distinct from it, refraction occurs when sound changes direction as it passes through regions of differing temperature or density—warm air rising from a sun-baked stage causes outdoor sound to bend upward, which is why a mix at front-of-house can sound radically different at the back of the crowd on a hot afternoon.
Compression, Rarefaction, and the Wave
Put your hand in front of a speaker while music is playing. You can feel the cone pushing air toward you and pulling it back. That push and pull is the fundamental mechanism of all sound. Every sound you have ever heard started with something vibrating: a speaker cone, a vocal cord, a drum head, a guitar string, a closing door.
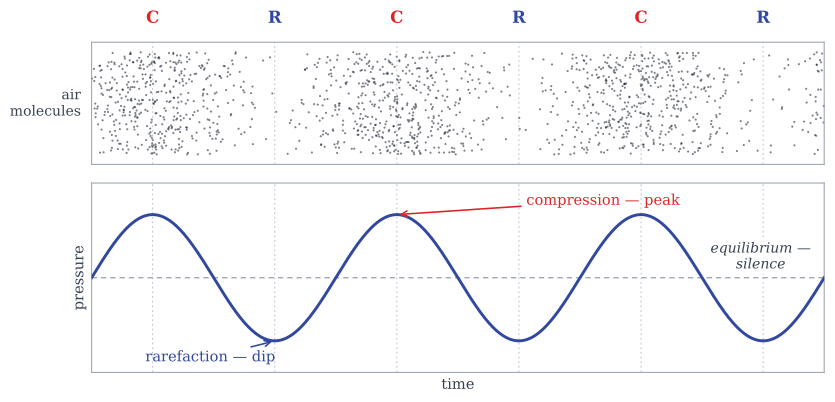
When a sound source vibrates outward, it shoves nearby air molecules together, creating a zone of high pressure called compression. Those compressed molecules push on the ones next to them, and the disturbance ripples outward like a chain reaction. When the source pulls back inward, it leaves a gap—the molecules spread apart, creating a zone of low pressure called rarefaction. Then the source pushes out again, and the cycle repeats until the vibration stops and the energy dissipates.
Imagine dropping a rock in a pond. Each ring spreading outward is a compression—molecules bunched together. Between each ring is a rarefaction—a dip. The rings keep spreading until the energy runs out and the water settles back to stillness. Sound in the air works exactly the same way, except the waves are invisible and travel in three dimensions.
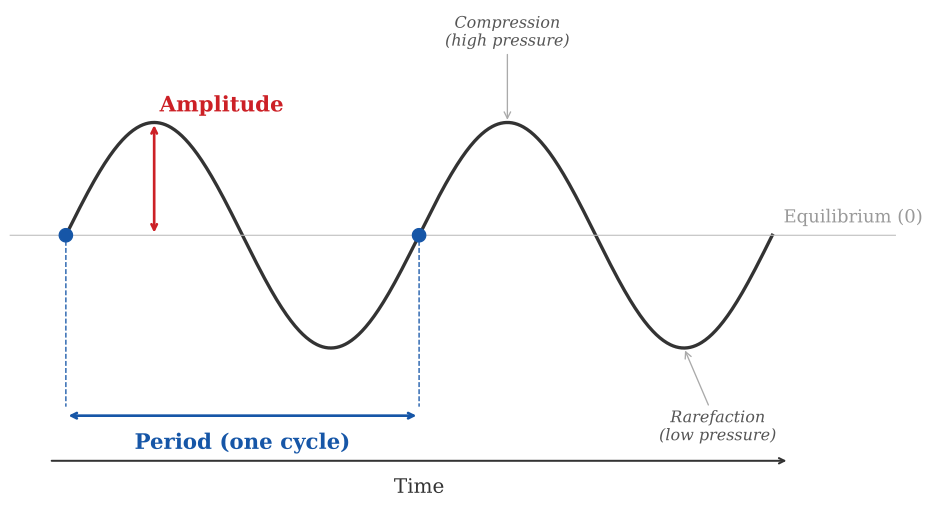
In the studio, we visualize these invisible waves using an oscilloscope, which displays sound as a waveform on screen. The center line represents silence—equilibrium. Peaks above the line are compression; dips below are rarefaction. The farther the wave swings from that center line, the louder the sound—this distance is called the amplitude. A whisper barely moves the line. A snare drum hit throws it to the edges.
Wavelength and Frequency
Now that you can picture the wave, let's measure it. One full push-and-pull—from equilibrium up through compression, back through equilibrium, down through rarefaction, and back to equilibrium—is called a cycle. The time it takes to complete one cycle is called the period, measured in seconds (or fractions of a second). The physical distance that one cycle covers as it travels through the air is the wavelength, measured in feet or meters. Both describe the same cycle—period measures it in time, wavelength measures it in space. To convert between them, multiply the period by the speed of sound: a cycle that takes 0.01 seconds has a wavelength of about 11.25 feet in air. It works in reverse, too—divide the wavelength by the speed of sound to get the period: 11.25 feet divided by 1,125 ft/s is about 0.01 seconds. One relationship, read either direction.
Here is where it gets interesting: not all wavelengths are the same. A bass note from a kick drum might have a wavelength of 20 feet or more. The sizzle of a cymbal might have a wavelength measured in fractions of an inch. Low-pitched sounds have long wavelengths and long periods; high-pitched sounds have short ones.
A high-pitched sound repeats its cycle many more times per second than a low-pitched one. The number of times a sound wave completes its cycle per second is the frequency. This is the single most important concept in audio: low pitch = long wavelength = low frequency. High pitch = short wavelength = high frequency. Every EQ move you will ever make, every microphone choice, every acoustic treatment decision—all of it comes back to frequency.
Frequency is measured in Hz (Hertz), where 1 Hz equals one complete oscillation per second. Humans hear a frequency range of 20 Hz to 20,000 Hz (20 kHz). 20 Hz is like a rumble—a sound you feel more than you hear. 20 kHz is like a dog whistle—right at the edge of what a human ear can detect. At the top, most people stop hearing well somewhere around 16 kHz, and that ceiling drops with age—high-frequency hearing loss is a normal part of getting older. The bottom is a different story. Your ears can detect—and your body can feel—frequencies well below 60 Hz. The reason you often don't hear the lowest bass isn't your hearing; it's that most speakers, especially small ones, can't physically reproduce it. Down there, you feel the sound as much as you hear it.
Frequencies above the human hearing range are referred to as ultrasonic frequencies, and frequencies below are called infrasonic (or subsonic) frequencies. Here are the approximate hearing ranges of some common animals (figures vary by species and measurement method):
| Animal | Range (Hz) | Animal | Range (Hz) |
|---|---|---|---|
| Human | 20–20,000 | Dog | 67–45,000 |
| Dolphin | 70–150,000 | Elephant | 16–12,000 |
| Mouse | 1,000–90,000 | Bat | 1,000–110,000 |
| Rabbit | 360–42,000 | Goldfish | 20–3,000 |
Dolphins can hear frequencies over seven times higher than humans. Research shows that dolphins use these ultrasonic frequencies similarly to how medical ultrasound works—they emit high-frequency pulses and interpret the reflections to build an image of their surroundings. Elephants can hear infrasonic frequencies, which scientists believe allows them to detect the rumble of distant herds over great distances.
The Frequency Spectrum
suggest a correctionWhen an engineer says a vocal sounds “muddy,” they are talking about too much energy around 200–400 Hz. When they say it needs more “air,” they mean the top end above 10 kHz. When they say the kick drum sounds “boxy,” they are pointing at 300–500 Hz. This vocabulary is not subjective opinion—it maps directly to specific frequency ranges. Learning this map is one of the most practical things you will do in this course. One note before the map: the bands below are not equal-width slices, because hearing is logarithmic—the Octaves section just ahead explains why. Here is how the audible spectrum breaks down:
Bass (20 Hz to 200 Hz):
- 20–40 Hz — Rumble. A sound you feel more than you hear. Sometimes this is a low-end rumble that needs to be removed from certain instruments, or boosted on bass and kick drum. Essential for systems with subwoofers.
- 40–80 Hz — Sub-bass. Easily audible to most people, but difficult to reproduce on small speakers. With a subwoofer, these frequencies can also be felt physically. Often used to add weight to kick drums and bass lines.
- 80–200 Hz — Warmth. These upper bass frequencies add body and warmth to a sound. They sometimes need to be cut to reduce boominess. On smaller speakers, this is the lowest range that can be accurately reproduced, and what most listeners consider “bass.”
Low Mids (200 Hz to 750 Hz) — These frequencies often need to be cut to remove muddiness in vocals and the boxy, cardboard-like sound of a kick drum. However, cutting too aggressively in this range can leave a recording sounding thin.
Mid-Mids (750 Hz to 1.5 kHz) — Think of these frequencies as the sound of a telephone. Although they are essential to intelligibility and clarity, too much energy in this range can sound cheap and harsh.
High Mids (1.5 kHz to 5 kHz) — Often referred to as the “presence” range, these frequencies determine how far upfront a vocal or instrument sounds. Since the human ear is most sensitive to 3–4 kHz, this range is critical for clarity, but too much can easily cause listener fatigue.
Treble (5 kHz to 20 kHz) — This range is responsible for definition, brilliance, sparkle and air. Boosting these frequencies can increase clarity and openness; cutting them can reduce harshness. Sibilance (vocal “sss” sounds) is often associated with this range as well.
Octaves
suggest a correctionAn octave is the interval from one musical note to the next with double or half the frequency. When we go from the A above middle C (440 Hz) to the next A above that (880 Hz), the frequency doubles—one octave up. Go down from 440 Hz to 220 Hz and you have dropped one octave. The note name stays the same; only the register changes.
Here is why octaves matter in the studio: the entire bass range from 20 Hz to 200 Hz spans just over three octaves (about 3.3 octaves), and the treble range from 5 kHz to 20 kHz spans only two octaves—even though treble covers 15,000 Hz compared to just 180 Hz of bass. Our ears perceive pitch on a logarithmic scale, not a linear one. The musical distance from 40 to 80 Hz feels the same as 7 kHz to 14 kHz. This means that when you are working in the low frequencies, a change of just a few hertz makes a huge difference, whereas the same change would be imperceptible in the high range. The human hearing range spans roughly ten octaves (20 Hz to 20 kHz); a piano covers just over seven. This is also why 1 kHz is treated as the approximate center of the audio spectrum—it sits just above the middle of those ten octaves, close enough that the ear treats it as a natural center point. That is why test tones, calibration signals, and meter references are almost always pegged to 1 kHz.
I have watched new engineers try to surgically EQ a kick drum at 47 Hz versus 53 Hz, expecting two different results—and the cuts sounded identical. Six hertz at the bottom of the spectrum is a tiny fraction of an octave; the same six hertz somewhere up in the cymbals would not even register. Octaves, not hertz, are how the ear hears. Reach for the EQ accordingly.
Fundamentals, Harmonics and Timbre
suggest a correctionPlay a note on a piano and the same note on a guitar. They are the same pitch, the same frequency—so why do they sound completely different? The answer is twofold: harmonics (the spectral fingerprint of the sound) and the volume envelope, or ADSR, which we cover in detail later in this chapter (the shape of the sound over time). Understanding both is how you learn to hear inside a sound.
A pure sine wave contains only one frequency—the fundamental frequency, which determines the pitch (the note you hear). But almost no sound in the real world is a pure sine wave. Every acoustic instrument, every voice, every sound you record produces a fundamental frequency plus a series of higher frequencies called harmonics.
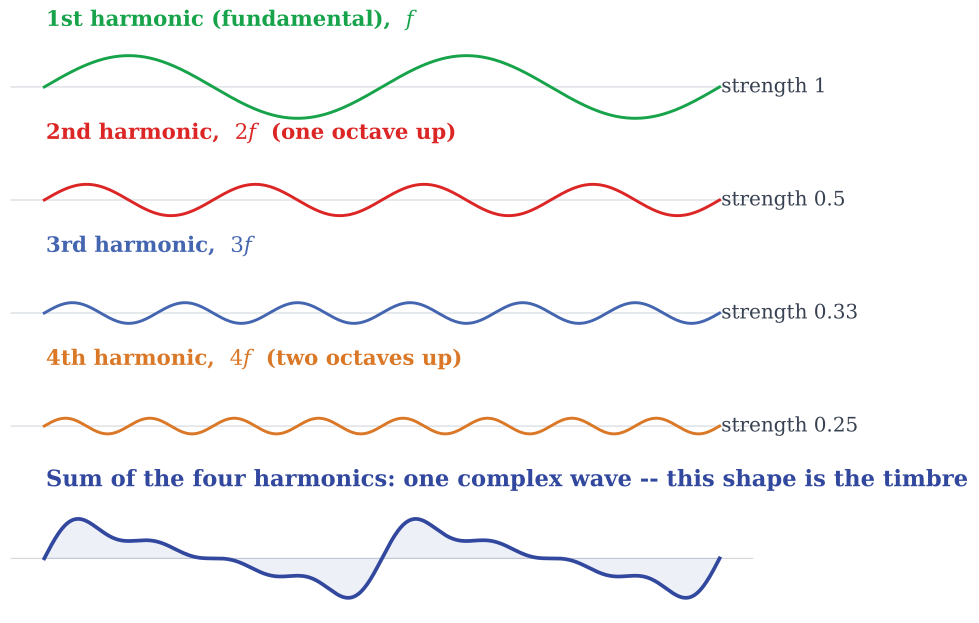
Harmonics are components of sound waves that are evenly spaced integer multiples of the fundamental frequency. If the fundamental frequency is 50 Hz, the harmonic series falls at 100 Hz, 150 Hz, 200 Hz, 250 Hz, 300 Hz and so on—integer multiples of the fundamental. But not every harmonic is present in every sound: which ones show up, and how strong each one is, depends on the instrument and how it is played. That mix is exactly what gives each sound its character. The relationship between the fundamental and its harmonics is a major part of what creates the texture or character of a sound, known as its timbre (pronounced “TAM-ber”). Timbre is what makes a piano playing middle C sound different from a guitar playing the same note. Both share the same fundamental frequency, but each instrument's combination of harmonics and its ADSR envelope is unique—and together those two things give every voice and instrument its sonic fingerprint.
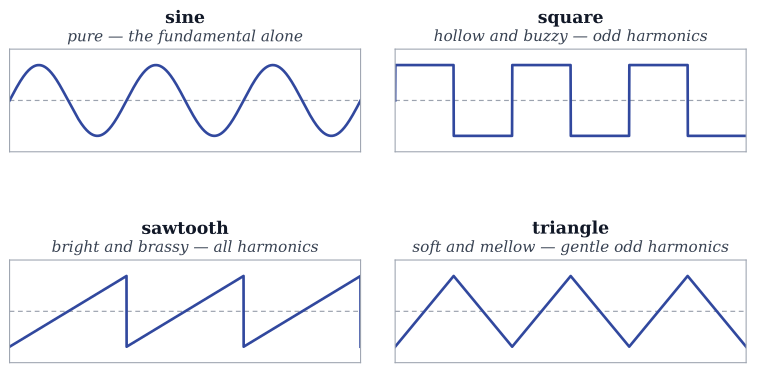
Other simple, repetitive sound waves include the square wave (hollow and buzzy, like a clarinet or a classic video-game tone), the sawtooth wave (bright, brassy, and cutting—the richest and most aggressive of the three), and the triangle wave (soft and mellow, the closest of the three to a pure sine), all of which contain harmonics. If you listen to these on a signal generator, you will hear the original sine wave in each one with the addition of various harmonics. Sound waves that occur naturally are far more complex than these basic shapes. A single source—one string, one reed, one drumhead—already produces a rich, irregular set of harmonics determined by how it vibrates and what it is made of. Layer multiple sources on top of that and the waveform becomes more complex still.
Hear the Waveforms
The four shapes above, as sound. Play each one and sweep its frequency — the brightness you hear is the harmonic content you see.
Noise: White, Pink and Beyond
suggest a correctionIf a pure sine wave contains one frequency and a musical note contains a fundamental plus its harmonics, noise sits at the opposite extreme of the spectrum: many frequencies sounding at once—in theory, all of them at once. Walk into any studio during setup and you will probably hear a steady hiss coming from the monitors. That is not a problem—it is an engineer calibrating the room with noise. Noise is aperiodic sound—random pressure fluctuations with no repeating pattern, unlike the periodic waveforms (sine, square, sawtooth, triangle) we have discussed so far. While noise is usually something to avoid in a recording, controlled noise is actually one of the most important tools in audio engineering.
White noise contains equal energy at every frequency across the audible spectrum. It sounds like a constant hiss—similar to a television tuned to a dead channel or the rush of air from a fan. It is called “white” by analogy with white light, which contains all visible wavelengths equally. Because it has equal energy per hertz, white noise sounds brighter and harsher than you might expect—the higher octaves contain far more total energy since each octave spans a wider range of frequencies.
Pink noise contains equal energy per octave rather than per hertz. This means it rolls off at higher frequencies (about 3 dB per octave), which makes it sound more natural and balanced to our ears—closer to a waterfall or steady rain. Pink noise is the standard signal used for calibrating studio monitors because it matches how we perceive loudness across the frequency spectrum. When you see an engineer walking around a room with an SPL meter and a pink noise generator, they are ensuring that every frequency range is being reproduced at the correct level.
Other types of noise include brown noise (also called Brownian or red noise), which rolls off even more steeply and sounds like a deep rumble or strong wind. Understanding these noise types becomes essential when working with synthesizers, sound design and acoustic measurement.
Decibels
suggest a correctionMy first session as the lead engineer, I overdrove a tracking chain by more than 10 dB before I caught it. The take was a keeper musically. The recording was unusable. The performer never knew, but I knew, and I made them do the take again. That session taught me what dB actually means: a few numbers between safe and ruined.
You will see the letters “dB” more than almost any other abbreviation in this book—on every meter, every fader, every plugin, every spec sheet. The decibel (dB) is a logarithmic unit used to measure the amplitude, volume, or loudness of a sound. Why logarithmic? Because our ears do not perceive loudness on a linear scale. The difference in acoustic power between the threshold of hearing and a jet engine is a factor of about ten trillion—a number that is useless in practice. The decibel system compresses that range into a manageable scale from 0 to about 194.
The dB Scales
There are several dB scales used in audio, each measuring a different domain. dB SPL (Sound Pressure Level) measures acoustic sound pressure in the air—what your ears hear. This scale starts at 0 dB SPL (the threshold of hearing—the quietest sound a healthy young ear can detect) and extends to a theoretical maximum of 194 dB SPL in earth's atmosphere.
Here is a reference for judging loudness in the dB SPL system (the table below):
| Source | dB SPL | Source | dB SPL |
|---|---|---|---|
| Loudest possible sound in air | 194 | Heavy truck (15 m), city traffic | 90 |
| Death of hearing tissue | 180 | Studio monitoring reference level | 85 |
| Rocket launch | 175 | Alarm clock (1 m), hair dryer | 80 |
| Firecrackers (peak) | 140 | Noisy restaurant, busy office | 70 |
| Short-term exposure damage | 140 | Air conditioning, conversation | 60 |
| Jet engine | 130 | Light traffic (50 m), home | 50 |
| Pain begins | 125 | Living room, quiet office | 40 |
| Jet takeoff (200 ft.) | 120 | Library, soft whisper (5 m) | 30 |
| Rock concert, nightclub | 110 | Recording studio, rustling leaves | 20 |
| Subway train | 100 | Hearing threshold | 0 |
To measure the loudness of digital audio—the levels inside your DAW—we use dBFS (decibels relative to Full Scale). This scale works in reverse: 0 dBFS is the absolute ceiling—the loudest possible level before digital clipping occurs. Everything below is a negative number (−6, −12, −20, and so on) descending all the way to −∞ dBFS, which represents complete digital silence. When you look at a fader or a meter in Pro Tools, you are reading dBFS.
dBu and dBV measure the voltage of analog audio signals—you will encounter these when working with outboard gear, preamps, and console specifications. The important thing is not to memorize every scale, but to understand that dB always means the same thing—a ratio expressed logarithmically—applied to different reference points depending on the domain.
Frequency Weighting: dBA and dBC
Not all decibels are equal to the ear. A 100 Hz tone at 70 dB SPL sounds noticeably quieter than a 3 kHz tone at the same measured level—the Fletcher–Munson curves we cover later in this chapter show exactly why. Frequency weighting filters compensate for this when measuring sound, applying a curve to the meter before it reports a level so that the number better reflects human perception.
dBA (A-weighted decibels) applies a curve that rolls off both the low and very high frequencies, closely approximating how the ear hears at moderate listening levels. It is the standard unit for occupational noise regulation: the OSHA and NIOSH exposure limits cited in the Hearing Conservation section of this chapter—85 dBA for 8 hours (NIOSH), 90 dBA for 8 hours (OSHA)—are A-weighted measurements. When you see a noise ordinance, an earbud safety rating, or any health-and-safety threshold, assume dBA unless stated otherwise. The “A” literally means “calibrated to match the ear.”
dBC (C-weighted decibels) uses a nearly flat curve across the audible range, departing significantly from dBA only below about 100 Hz and above about 8 kHz. Because it passes low-frequency content that A-weighting suppresses, dBC is preferred for measuring peaks, impulsive sounds, and sub-heavy program material. It is also the correct setting for monitor calibration: when you walk a room with an SPL meter and pink noise for the reference-level calibration described in the Studio Exercise at the end of this chapter—and in the full calibration workflow in Chapter 7—set the meter to C-weighted, slow response. A-weighting at calibration levels would underweight the bass and lead you to set your monitoring too loud. The “C” passes the whole signal so what you are measuring is what the speakers are actually doing in the room.
Modern Loudness Metering
In modern mastering and broadcast, loudness is also measured in LUFS (Loudness Units relative to Full Scale) and RMS (Root Mean Square). A peak meter tells you the loudest instantaneous moment in a signal, but that does not reflect how loud the signal sounds to a human ear—a sharp transient might hit −3 dBFS on the peak meter but sound quieter than a sustained chord hitting −6 dBFS. RMS solves this by calculating the average signal level over time, giving a much better indication of perceived loudness. The gap between a signal's peak level and its RMS level has a name—the crest factor—and it is a quick read on how dynamic that signal is: wide on a punchy, transient-rich performance, narrow on one that has been heavily compressed or limited. LUFS goes even further: it applies a perceptual weighting curve (based on how the ear actually hears different frequencies) and integrates the measurement over the duration of the program (ITU-R BS.1770-5), producing the most accurate representation of how loud a track will sound to a listener. Streaming platforms such as Spotify (−14 LUFS), Apple Music (−16 LUFS) and YouTube (−14 LUFS) normalize playback to specific LUFS targets, which means a master that is crushed to −8 LUFS will actually be turned down by the platform—defeating the purpose of over-compressing in the first place. Loudness metering is an essential part of the modern mastering workflow; we will discuss this further in Chapter 19.
Power and Perceived Loudness
suggest a correction“It's not how loud you make it. It's how you make it loud.”
—Bob Katz, Mastering Audio: The Art and the Science
Here is something that surprises most people: to double the actual physical power of a signal, you only need to add 3 dB. To quadruple it, 6 dB. To multiply it by ten, just 10 dB. But our ears do not agree with the physics. A 3 dB change—which doubles the power—is barely perceptible to most listeners. You need a full 10 dB increase before a sound is perceived as twice as loud. This disconnect between measured power and perceived loudness is one of the most important concepts in audio, and it affects every mixing and mastering decision you will ever make.
| dB Change | Actual Power Change | Perceived Loudness Change |
|---|---|---|
| 1 dB | 1.26× | Barely detectable |
| 3 dB | 2× (double) | Just perceptible |
| 5 dB | 3.16× | Clearly noticeable |
| 6 dB | 4× (2× amplitude) | Moderate change |
| 10 dB | 10× | Perceived as twice as loud |
| 20 dB | 100× | Perceived as four times as loud (approximate) |
The Inverse Square Law
suggest a correctionI once tracked a vocalist who kept drifting back and forth from the microphone—half an inch closer one take, an inch farther the next. The takes were emotionally consistent and technically unusable. The level changed by several dB between every take, and the proximity effect went with it. Inverse square law is not a physics curiosity; it is the reason mic position matters.
Sound intensity decreases predictably with distance. The inverse square law states that the intensity of sound is inversely proportional to the square of the distance from the source. In practical terms, every time you double the distance from a sound source, the intensity drops by approximately 6 dB (Everest & Pohlmann, 2015). Move twice as far away again, and it drops another 6 dB.
This has direct implications for studio work. A microphone placed 6 inches from a vocalist will capture a signal roughly 6 dB louder than one placed 12 inches away, and about 12 dB louder than one at 24 inches. This is why small changes in mic distance can have a dramatic effect on the recorded signal—especially in the low frequencies, where the proximity effect (a boost in bass response that increases as a directional mic gets closer to the source) compounds the change.
The inverse square law also explains why studio monitors should be positioned at consistent, measured distances from the listening position. If one monitor is even slightly closer than the other, the perceived volume balance between left and right will be off, which can lead to poor mixing decisions. For critical listening, the monitors and the listener should form an equilateral triangle.
The Volume Envelope (ADSR)
suggest a correction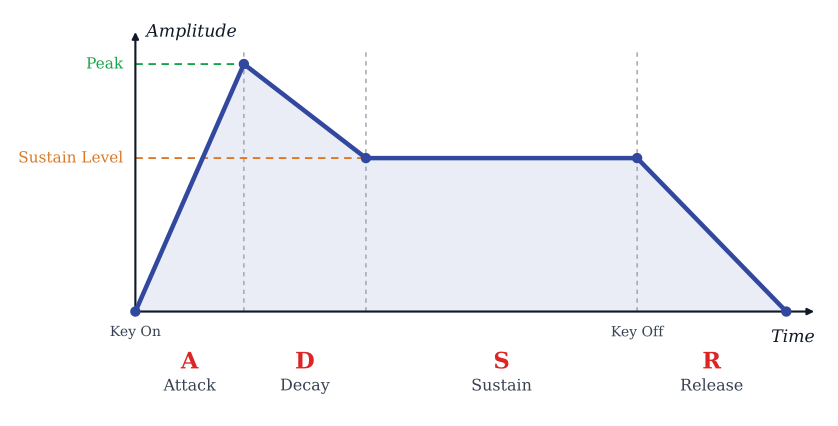
Hear the Envelope
The four stages above, on a real note. Shape attack, decay, sustain, and release, then trigger the note and listen to the contour you drew.
The volume envelope describes how a sound's amplitude changes over time, and it is universally broken into four stages: attack, decay, sustain, and release—together, ADSR. Take a piano note and a string pad as a comparison. The piano has a fast attack—it reaches peak volume the instant the hammer strikes the string. The string pad has a slow attack, swelling from silence over hundreds of milliseconds. Decay is the time the sound falls from that initial peak down to its steady volume; on an acoustic instrument this phase is usually longer than the attack. Sustain is the level the sound holds while the note is still being played—a key pressed down, a bow drawn, a breath sustained. There is no fixed time for sustain; it lasts as long as the source keeps producing sound. Release is what happens when the note ends—the time it takes the sound to die away to silence. A vibraphone, a gong, or a piano with the sustain pedal down all have long release times; a muted guitar or a staccato note has almost none.
Every compressor, every synthesizer, and every dynamic plugin you will ever use is shaping ADSR in some way. Hearing those four stages in any sound is one of the foundational skills of mixing.
Equal Loudness Contours (Fletcher–Munson Curves)
suggest a correctionEarly in my career, I mixed a track at conversation volume—around 60 dB SPL on the monitors. The bass and the air felt great in my ears. When I cranked the monitors up to my reference level of 85 dB to bounce, the bass was thunderous and the high end was painful. I had been adding what my ears could not hear at 60, not realizing the mix was overcompensating for Fletcher–Munson. That was the day I started mixing at a fixed reference—85 dB worked in that room, though on nearfields many engineers settle a few dB lower—and checking the result at three different volumes.
Have you ever noticed that when you turn your monitors down low, the bass seems to disappear—but when you crank them up, the low end comes roaring back, even though you did not touch the EQ? You are not imagining it. Our ears are not flat. We are more sensitive to certain frequencies than others, and that sensitivity changes depending on how loud the sound is. This is one of the most important things you will learn in this entire book.
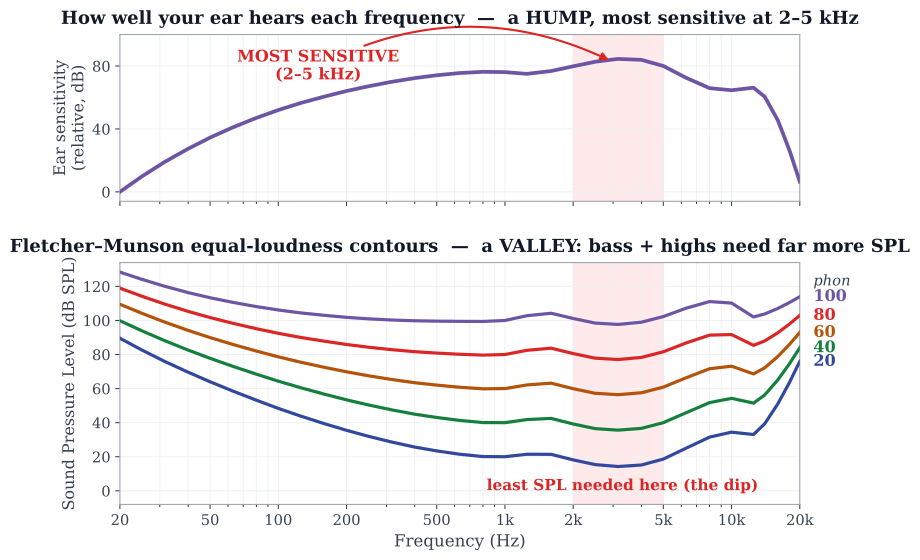
Harvey Fletcher and Wilden A. Munson were scientists in the 1930s who created the first equal loudness contour curves. In their study, listeners were presented with pure tones at various frequencies and intensities. For each test tone, a reference tone at 1,000 Hz was adjusted until it was perceived as equally loud. The resulting Fletcher–Munson curves show that our sensitivity to frequencies relative to one another fluctuates with changes in volume. Specifically, at louder volumes we perceive bass frequencies more prominently relative to the rest of the spectrum than we do at lower volumes.
This graph is instrumental in demonstrating that humans perceive sound differently at different volumes. Our ears come closest to a flat frequency response at higher listening levels—the contours grow more uniform as the overall level rises, though they never become truly flat. That is the reasoning behind a calibrated monitoring reference: around 85 dB SPL is the long-standing film and large-room standard, while many music engineers working on nearfields settle a few dB lower, in the 79–83 dB range (see Chapter 7). The point is a consistent level you mix at every day, not a magic number at which hearing flattens. (Note: the original Fletcher–Munson data was later refined by Robinson and Dadson, and the current international standard is ISO 226, revised in 2023, but the fundamental principles remain the same.)
Hearing Conservation
suggest a correctionI know an engineer—one of the best I have ever worked with—who cannot hear anything above 8 kHz in his left ear. He tracked drums for years without earplugs. He was twenty-nine when the audiologist told him the damage was permanent. Now he mixes with his right ear tilted toward the monitors and compensates with a calibration profile. He is still brilliant. But he will tell you himself: it did not have to be this way.
Your ears are the most important tools you own. Unlike a blown speaker or a broken cable, damaged hearing cannot be replaced. Noise-induced hearing loss is permanent, cumulative, and entirely preventable.
OSHA and NIOSH set noise exposure limits for the workplace. (OSHA permissible exposure limit, 29 CFR 1910.95; NIOSH recommended exposure limit, Criteria for a Recommended Standard: Occupational Noise Exposure, NIOSH Publication No. 98-126 (1998).) OSHA's permissible exposure limit is 90 dBA for 8 hours, using a 5 dB exchange rate: 95 dBA allows 4 hours, 100 dBA allows 2 hours, 105 dBA allows 1 hour, 110 dBA allows 30 minutes, and 115 dBA allows just 15 minutes. NIOSH recommends a more protective limit of 85 dBA for 8 hours with a 3 dB exchange rate: 88 dBA allows 4 hours, 91 dBA allows 2 hours, and 94 dBA allows just 1 hour. A typical rock concert runs 100–115 dBA. A close snare drum hit can exceed 120 dBA. Even prolonged headphone listening at moderate volumes can cause cumulative damage over years.
Protect your hearing with these practices: Monitor at reasonable levels—if you have to shout to be heard over your monitors, they are too loud. Take regular breaks during long sessions (for every 20–30 minutes of focused listening, take a short break). Wear high-fidelity earplugs—not foam, but musician's earplugs from companies like Etymotic or ACS Custom that attenuate evenly across frequencies—when attending concerts, working live sound, or tracking loud instruments. Never wear them while mixing or mastering: those decisions require your ears flat, open, and uncovered. Get your hearing tested annually by an audiologist. Tinnitus—a persistent ringing in the ears—is the most common early warning sign of hearing damage.
You will have a long career in this industry. Make sure you can still hear the music at the end of it.
Phase and Interference
suggest a correctionUp until now, we have talked about a single sound wave traveling on its own—a pure tone, a vocal, a kick drum—but in the studio, sounds rarely arrive alone. The moment two waves of the same source meet (different mics on a vocal, a direct sound and its reflection off a wall, a subwoofer and a main monitor), the way they line up in time determines whether they reinforce or cancel each other. That timing depends on each wave's phase—where it is in its cycle at any given moment. Phase issues show up in three domains every engineer encounters: multi-microphone setups, room acoustics, and monitor calibration.
In Phase, Out of Phase
Phase is measured in degrees from 0° to 360°. Think of one complete cycle of a wave—from equilibrium, up to peak compression, back through equilibrium, down to peak rarefaction, and back to equilibrium—as a full 360° rotation. The peak of compression is at 90°, the zero crossing on the way down is at 180°, the peak of rarefaction is at 270°, and 360° brings you back to the start. When two or more sound waves are present at the same time, their phase relationship determines whether they strengthen each other or cancel each other out.
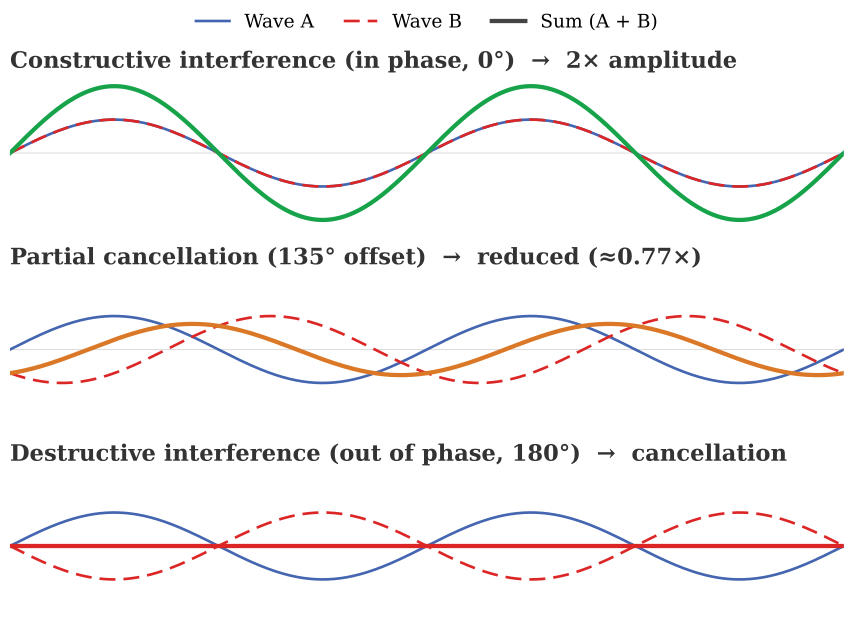
When the compressions and rarefactions of two waves align (in phase), they strengthen each other and create a wave with higher intensity. This is known as constructive interference.
Hear Phase Cancellation
Two identical sine waves play together. Flip one out of phase and listen to the signal disappear — this is the cancellation the diagram shows.
When the compressions and rarefactions are misaligned (out of phase), their interaction creates a wave with reduced intensity. This is destructive interference. When waves are interfering destructively, the sound may be louder in some places and softer in others, creating audible pulses or beats. When two waves are completely out of phase (180° apart), they cancel each other out entirely.
Comb Filtering Across Domains
Anytime more than one wave is present simultaneously, phase must be considered. A common example is recording a snare drum. A typical microphone technique is to place one mic below the snare and one above, pointed at each other. Because the two diaphragms face opposite directions, the same sound wave hits one mic as compression and the other as rarefaction—they are 180° out of phase. If you do not invert the polarity on one mic, the two signals will partially cancel each other, making the snare sound thin and weak. Flip the phase on one channel and the snare instantly sounds fuller and punches through the mix.
Phase issues are not always this obvious. When you use multiple microphones on any source—a drum kit, a guitar amp with a close mic and a room mic, or even a vocalist with bleed from the headphones—the signals arrive at each mic at slightly different times, creating partial phase cancellation at certain frequencies. This is called comb filtering, and it produces a hollow, filtered tone that no amount of EQ can fix. The solution is always physical: move the microphones until the phase relationship improves, or use the 3:1 rule (discussed in Chapter 6) to minimize interference (Owsinski, 2017).
The same comb filtering shows up in the other two domains. In room acoustics, every reflection off a wall, ceiling, or floor arrives at your ears slightly later than the direct sound, creating phase cancellation at certain frequencies—which is why an untreated room can sound radically different two feet to the left or right. In monitor calibration, a subwoofer placed out of phase with the main monitors will either cancel the low end at the listening position or reinforce it elsewhere in the room. Time-aligning the sub with the mains is part of any serious calibration. The principle is the same in all three domains: when two versions of the same wave arrive at slightly different times, phase decides whether they add up or cancel out. Learning to hear phase problems is one of the most valuable skills an engineer can develop—and one of the hardest.
The Doppler Effect
suggest a correctionYou have heard this a thousand times without knowing its name. An ambulance races toward you—the siren sounds high-pitched and urgent. The moment it passes and drives away, the pitch drops. That is the Doppler effect—the change in perceived frequency when a sound source is moving toward or away from a listener. As it approaches, the frequency of the siren sounds higher; as it passes and moves away, the frequency sounds lower.
When the source is moving toward the observer, each successive wave crest is emitted from a position closer than the previous one. The waves “bunch together,” reducing the distance between wave fronts and increasing the perceived frequency. Conversely, when the source moves away, each wave is emitted from a position farther away, causing the waves to “spread out” and decreasing the perceived frequency.
Doppler matters in the studio whenever you need a sound to feel like it is moving past the listener. I have used the effect intentionally for film and video sound design—automating pitch and amplitude together so a vehicle, a projectile, or a creature feels like it is whipping past the camera. The pitch rises and the volume rises as the source approaches; both fall as it recedes. A simple pitch envelope plus a volume envelope, in opposite curves on either side of the pass-by point, sells the illusion. The same trick whips a car horn or an effect past the listener in hip-hop production. And once you can hear Doppler, you start hearing it everywhere: in helicopters, passing cars, and the rotating horn of a Leslie speaker, which produces a real mechanical Doppler effect by spinning the sound source through the air.
Psychoacoustics
suggest a correction“Listening is not the same as hearing and hearing is not the same as listening.”
—Pauline Oliveros, Deep Listening: A Composer's Sound Practice
Everything we have covered so far—frequency, amplitude, wavelength, decibels, Fletcher–Munson—describes the physics of sound. But we do not mix for oscilloscopes. We mix for human ears, and human ears are weird. Psychoacoustics is the scientific study of how humans perceive sound, and it explains why our experience of sound often contradicts what the meters tell us. The next few sections cover the mechanisms of hearing and the perceptual tricks that every mix engineer exploits—whether they know it or not.
How We Hear
suggest a correctionClose your eyes and snap your fingers to your left. Without looking, you know exactly where that sound came from—how far away, what direction, even roughly how high off the ground. Your brain did that in milliseconds, using nothing but air pressure variations hitting two small membranes on either side of your head. The ear is a staggeringly sophisticated transducer. The visible part—the fleshy flap called the pinna—funnels sound through the ear canal to the tympanic membrane (eardrum), which vibrates in response to pressure changes. Those vibrations are transmitted through tiny bones to the cochlea, where they are converted into nerve impulses that the brain interprets as sound. The ear receives; the brain hears.
By having two ears, humans can locate the direction and distance of a sound—a process called binaural localization. The brain uses three cues. First, interaural intensity differences: a sound from your left is louder in the left ear than in the right. Second, interaural arrival-time differences: a sound from your right reaches the right ear before the left, by a fraction of a millisecond. Third, pinna filtering: the ridges, bumps, and shape of the pinnae (the visible part of your ears) create tiny delays between the direct sound and reflections off the ear's own contours. Those micro-delays let the brain determine height and front-vs-back as well as left-vs-right—which is why you knew, when you snapped your fingers a moment ago, not just that the sound was to your left but roughly how high off the ground.
A mix engineer who understands binaural localization can exploit it to place sounds in three-dimensional space without ever leaving stereo. I have mixed sound effects for film by panning each element slightly off-center and adding a sub-millisecond delay to one side—the brain treats the offset as direction, and a listener will instinctively turn their head toward where the sound seems to live. Once you start mixing with the brain's localization machinery in mind, the stereo field stops being a left-right slider and becomes a room.
Masking, Precedence and Selective Hearing
suggest a correctionThe first time I unmasked a vocal that had been buried in a mix, I felt like I had pulled off a magic trick. The producer had asked for the vocal to be louder; the artist had asked for the band to keep its energy. Both wanted opposite things. I cut a narrow notch on the rhythm guitar in the range where the vocal sat, and the vocal came forward without anyone losing anything. That is masking, and that is what EQ is actually for.
Frequency masking occurs when a louder sound makes a quieter sound in a similar frequency range inaudible or harder to hear. If a loud electric guitar is playing in the same frequency range as a vocal, the vocal may become partially or fully masked—even though both signals are present in the mix. This is the fundamental reason why equalization (EQ) exists: by cutting frequencies in one instrument that overlap with another, you “unmask” the quieter sound and create clarity. Every mixing decision involving EQ is, at its core, a psychoacoustic decision about masking.
Masking also occurs in the time domain. A loud sound can mask a quieter sound that occurs just before it (backward masking) or just after it (forward masking). This is why compressors and limiters are used in mastering—by controlling the loudest peaks, quieter details that would otherwise be masked become audible.
The precedence effect (also called the Haas effect) describes how the brain determines the direction of a sound. When a sound arrives and is immediately followed by a delayed copy of itself (within about 1 to 30 milliseconds), the brain perceives both as coming from the direction of that first arrival. The later arrival is not heard as a separate event—instead, it is fused with the first arrival and adds a sense of spaciousness and width. This principle is used extensively in mixing: short delays (under 30 ms) panned to one side can make a sound appear wider without creating an audible echo.
The cocktail party effect (also called selective hearing) refers to the brain's remarkable ability to focus on a single sound source in a noisy environment—like following one conversation at a loud party. The brain uses a combination of binaural cues, frequency filtering and pattern recognition to isolate the desired signal from background noise. For producers and mix engineers, this phenomenon is a reminder that clarity and separation between instruments are just as important as loudness. A well-mixed track allows the listener's brain to “focus in” on any element—the vocal, the bass, the hi-hat—without effort.
These three psychoacoustic phenomena—masking, precedence, and selective hearing—are not just theory. They are the reason mixing works at all. When you pan a guitar to the left and a keyboard to the right, you are exploiting binaural localization to reduce masking. When you add a short stereo delay to a vocal, you are using the precedence effect to create width. When you carve out a pocket in the guitar's EQ to let the vocal through, you are solving a masking problem. Every great mix is, at its core, a series of psychoacoustic decisions—whether the engineer thinks of them that way or not.
Critical Bands, Phons, and the Missing Fundamental
Critical bands explain why frequency masking works the way it does. The cochlea does not process the entire spectrum as one continuous signal—it behaves like a bank of overlapping bandpass filters, each roughly a third of an octave wide, stacked across the hearing range. Masking happens inside a band, not across the whole spectrum: a loud guitar at 2 kHz will mask a quieter vocal at 2.2 kHz because they compete within the same filter. Bump the guitar down to 1.5 kHz and the vocal can coexist at much lower level without being swallowed. This is the physics behind surgical EQ. When two instruments a musical fourth apart—say, a guitar chord voiced around 400 Hz and a bass line sitting at 300 Hz—feel like they are fighting each other in the low mids, it is often a critical-band conflict: both are landing inside the same cochlear filter. A narrow cut on one instrument, right at the frequency where the other lives, relocates one of them outside the band. The conflict resolves. That is not guesswork—it is how the ear actually works.
The phon is the unit that puts a number on the equal-loudness curves. One phon equals the loudness level of a pure 1 kHz tone at a given dB SPL—by definition, 60 phons is a 1 kHz tone at 60 dB SPL. Every point on the same Fletcher–Munson contour, regardless of frequency, is perceived as equally loud and shares that phon value. A 100 Hz tone that sits on the 60-phon curve requires roughly 79 dB SPL to sound as loud as the 60 dB SPL reference at 1 kHz—the ear is simply less efficient in the bass at moderate levels. When we say monitoring at 85 dB SPL flattens the ear's response, we are saying the phon contours compress toward horizontal near that level—every frequency band demands roughly the same SPL to register as equally loud.
Some of the most useful bass in modern music comes from frequencies the speakers cannot reproduce. The missing fundamental is the brain's ability to reconstruct a perceived pitch from its harmonic series even when the fundamental itself is absent. If the 2nd, 3rd, and 4th harmonics of a 60 Hz note are present—120, 180, and 240 Hz—the brain assembles a 60 Hz sensation even though no actual 60 Hz energy exists. This is why a phone speaker seems to have bass it is physically incapable of reproducing: the harmonics are there, and the auditory cortex fills in the rest. Bass-enhancement processors like Waves MaxxBass and Renaissance Bass (and any “sub-harmonic synthesizer” in that class) do exactly this—they generate targeted harmonics above the fundamental so the bass story survives on small speakers. The mixing payoff is significant: when you add harmonic density to a bass or kick through even mild saturation or a dedicated processor, the low-end weight translates to earbuds, phone speakers, and laptop playback where the sub-bass simply does not go. Harmonics carry the bass story to systems that cannot tell it themselves.
The Why Behind the What
suggest a correctionSound theory is the foundation everything else in this book is built on. Every tool you will learn to use—EQ, compression, reverb, microphone technique, monitor placement—is an application of the physics and psychoacoustics covered in this chapter. The engineers who understand the why behind the what will always make better decisions than those who rely on presets and guesswork.
When you reach for an equalizer, you are manipulating frequency. When you set a compressor, you are controlling ADSR—the volume envelope—and amplification. When you choose a microphone for a particular source, you are making decisions about polar patterns, frequency response curves, and proximity effect—all concepts rooted in the physics of sound propagation. When you position acoustic treatment in a room, you are controlling reflections, standing waves, modal resonance, and phase. None of these tools exist in isolation; they are all expressions of the same underlying principles.
The critical listening exercises in this chapter's Studio Exercise are not optional extras—they are the beginning of the most important skill you will develop as an engineer. Gear changes, software updates, trends come and go, but trained ears are permanent. Start now, practice deliberately, and revisit these exercises throughout the course. By the time you reach the mixing and mastering chapters, you will hear things in a recording that you cannot hear today—and that transformation is what separates a technician from an engineer.
None of this is abstract anymore. You now have the vocabulary to describe what you hear, the physics to explain why it happens, and the foundation to make informed decisions about what to do next. That foundation will carry you through every chapter that follows.
Review Questions
Work these before moving on — every question is answerable from this chapter. Written answers live in the instructor Answer Key, available to course adopters.
- What is sound?
- How does sound travel through a medium? Explain compression and rarefaction.
- What is the amplitude of a waveform?
- What is the wavelength of a waveform?
- What is the frequency of a waveform, and what unit is it measured in?
- Frequencies above the human hearing range are referred to as __________ frequencies, and frequencies below are called __________ frequencies.
- Match each frequency range below to its name (bass, low mids, mid-mids, high mids / presence, treble):
- 20 Hz – 200 Hz
- 200 Hz – 750 Hz
- 750 Hz – 1.5 kHz
- 1.5 kHz – 5 kHz
- 5 kHz – 20 kHz
- True or False: 880 Hz is exactly one octave above 220 Hz.
- How much of an increase in dB is needed to double the physical power of a signal?
- How much of an increase in dB is needed to perceive a doubling of loudness?
- True or False: The Fletcher–Munson curves demonstrate that our perception of the audible frequency spectrum changes at different amplitudes.
- Harmonics are:
- The same frequency as the fundamental
- Different volume levels of a waveform
- Integer multiples of the fundamental frequency
- Random frequencies added to a waveform
- What is the timbre of a sound? Why does a piano playing middle C sound different from a guitar playing the same note?
- Explain the difference between constructive and destructive interference. Give a practical studio example of how phase problems can affect a recording.
- What are the three ways humans localize the direction of a sound?
- Describe the four stages of the ADSR volume envelope and give an example instrument for each type of attack (fast vs. slow).
- What is a typical studio monitoring reference level, and why mix at a fixed reference at all? Why might a music engineer on nearfields calibrate a few dB lower than the film standard? (Hint: Fletcher–Munson)
- According to the inverse square law, how much does the sound level drop each time you double the distance from the source? If a microphone is moved from 6 inches to 24 inches from a vocalist, approximately how many dB quieter will the signal be?
- What is the difference between white noise and pink noise? Which is used for studio monitor calibration, and why?
- Explain frequency masking. How does this psychoacoustic phenomenon relate to equalization (EQ) in mixing?
- What is the precedence effect (Haas effect), and how do mix engineers use it to create a sense of width in a stereo mix?
- What are the OSHA and NIOSH noise exposure limits? Include the starting levels and exchange rates for each.
- Describe three practices for protecting your hearing as an audio professional.
- Explain the “frequency identification” exercise and why it is useful for developing critical listening skills. (The exercise is described in the Studio Exercise that follows.)
- Why is level matching essential when A/B comparing two audio settings? (See the Studio Exercise that follows.)
- What is the Doppler effect? Give an everyday example.
- What is the cocktail party effect, and what does it teach us about mixing for clarity?
- You are mixing a dense pop record. At your calibrated 83 dB SPL reference level the lead vocal sounds clear and balanced. When you turn the monitors down to roughly 65 dB SPL for a late-night check, the vocal seems to disappear into the track. Using at least three psychoacoustic principles from this chapter, explain why this happens and describe two concrete mixing decisions you would make to address it—without simply turning the vocal up.
Studio Exercise: Train Your Ears
Here is a secret that separates great engineers from good ones: it is not their gear. It is their ears. A great engineer can walk into an unfamiliar room with unfamiliar monitors and still make decisions that translate—because they have trained their perception through thousands of hours of deliberate listening. Start that training now, and revisit these drills throughout the book. Most need only a DAW, headphones, and a few commercial tracks—no full studio required. A couple of the drills below use EQ and compression, which we cover fully in Chapters 15 and 16—make your best first pass now with stock plugins; a genuine first attempt is all that is asked for your Chapter 2 submission.
Required:
- Frequency Identification. Load a familiar track into your DAW and insert any parametric EQ (every DAW ships one). Boost a narrow band by 6–10 dB and sweep it slowly across the frequency spectrum. Listen to how the character of the sound changes at each range. Practice identifying the boosted frequency with your eyes closed. Over time, you will learn to associate specific qualities with specific ranges: 200–400 Hz sounds “boxy,” 800 Hz–1 kHz sounds “nasal,” 2–4 kHz sounds “present” and “harsh,” 8–12 kHz sounds “airy” and “sibilant.” Run this drill on at least ten different boosts and log your guess vs. the actual frequency for each.
- Compression Detection. Set up a track with and without compression. Start with obvious settings—high ratio, fast attack—and gradually move to subtler ones. Train yourself to hear the reduced dynamic range, the change in transient character, and the increase in perceived sustain. Then listen to a commercial track in your favorite genre and write down whether you think it is lightly, moderately, or heavily compressed—and which musical elements give it away.
- Level Matching. The single most important habit you will develop. When comparing two settings—EQ in or out, compression on or off, saturation applied or bypassed—match perceived loudness first using a LUFS or RMS meter. A peak meter alone won't catch the bias: two signals can hit the same peak and still sound dramatically different in loudness. Set up an A/B between two versions of the same source (one with and one without a processor of your choice) and document the LUFS values you used to match them.
- Reference Track Analysis. Import a commercial reference track in the same genre as something you are working on (or have made before). Compare your frequency balance, dynamic range, stereo width, and loudness against it. Write a one-paragraph reflection on the gap between your work and the reference—and one specific thing you would change next time. The Suggested Listening chapter at the back of this book provides starting points organized by genre and skill.
- Pink Noise Calibration. Calibrate your studio monitors at 85 dB SPL using a pink noise generator and an SPL meter. Free phone apps work well for the SPL meter (NIOSH SLM, Decibel X). Play pink noise through both monitors at unity gain, position the SPL meter at your listening position (ear height, equilateral triangle from the speakers), and adjust the monitor controller until the room reads 85 dB SPL. Document the monitor controller setting. From now on, return to this level whenever you are making critical listening or mixing decisions.
- Phase Audibility Drill. Open a DAW and create two identical mono tracks. On each, generate the same pure sine wave at 1 kHz (a test-tone plugin or your DAW's signal generator). Pan both center. Listen: the combined signal should be 6 dB louder than either alone—constructive interference, in phase. Now invert the polarity on one track. Listen: the signal should disappear entirely—destructive interference, 180° out of phase. Then offset one track by a few milliseconds and listen for the comb filtering and beating that emerge as the phase relationship shifts. This is the most direct way to feel what phase actually does.
Optional:
- Reverb Type Identification. Apply the same dry vocal recording through different reverb types: room, plate, hall, spring, chamber. Listen to the differences in decay time, density, early reflections, and tonal color. Then listen to commercial recordings and try to identify the reverb type used on the lead vocal, snare, or guitar.
- Stereo Image Awareness. Listen to a well-mixed song on headphones. Close your eyes and map where each instrument lives in the stereo field. Then listen to the same song on monitors and notice how the image changes. Switching regularly trains you to make mix decisions that translate across both.
- Volume Perspective. Mix a session at a moderate level for ten minutes. Then turn the monitors down to conversation volume and listen. Elements that sat well at loud volume may suddenly disappear—Fletcher–Munson in action—telling you that those elements are not cutting through on their own. Checking your mix at multiple volumes is one of the simplest and most revealing habits you can build.
Deliverable: A single PDF or document including:
- Frequency identification log: 10 boosted frequencies, your eyes-closed guess for each, the actual value, accuracy summary.
- Compression detection: a screenshot of your A/B setup and a one-paragraph reflection on what you heard.
- Level matching: a screenshot showing matched LUFS or RMS for two A/B settings.
- Reference track analysis: name your reference track and the one-paragraph comparison.
- Pink noise calibration: a photo of the SPL meter at 85 dB SPL plus the monitor controller setting that gets you there.
- Phase audibility drill: a short audio export or screen recording of the in-phase, polarity-inverted, and time-offset states, plus a one-paragraph reflection.